
Apresentação de 2020 (slide 2)
Regulation of the Growth Plate
Multiple phases of chondrocyte enlargement underlie differences in skeletal proportions
Regulation of body growth by microRNAs
Growth Plate Chondrocytes: Skeletal Development, Growth and Beyond doi:10.3390/ijms20236009 (ver imagem abaixo)
A radical switch in clonality reveals a stem cell niche in the epiphyseal growth plate
Upregulated FGFR3 and Stat–p21Cip1 in chondrodysplasias
Fibroblast growth factor 18 & Wnt signaling
On the evolutionary relationship between chondrocytes and osteoblasts
Primary human chondrocytes in culture and chondrogenesis in human bone marrow stem cells
Growth rate and expression of local growth plate regulators
24R,25-Dihydroxyvitamin D3 controls growth plate development
Metabolic reprogramming chondrogenesis & osteogenesis
Catch-up growth: possible mechanisms
Dois artigos relacionados com o desenvolvimento de sistemas in vitro para o estudo da placa de crescimento dos ossos longos:
Growing Pains: The Need for Engineered Platforms to Study Growth Plate Biology e Roles of Local Soluble Factors in Maintaining the Growth Plate: An Update
Apresentação de 2020 (slide 2)
 |
Cellular events and molecular markers of chondrogenesis, chondrocyte differentiation, and AC (articular cartilage) development and maintenance. (A) Model of endochondral bone development beginning with mesenchymal cell condensation (i); chondrocyte differentiation and development of the cartilage template (ii); chondrocyte maturation and hypertrophy (iii); separation of cartilage growth regions, vascular invasion, and initiation of both cortical and trabecular bone (iv); and finally generation of the secondary center of ossification that separates AC and GP cartilage during postnatal bone development (v). MC, marrow cavity; 2o, secondary center of ossification. Red lines mark the vasculature, and yellow coloration marks mineralized bone. Black box outlines AC region magnified in B. (B) Graphical representation of the distinct cellular zones in postnatal AC. IZ, intermediate zone; RZ, radial zone; TM, tide mark; ZCC, zone of calcified cartilage; SB, subchondral bone; M, marrow. Vertical lines indicate zones of gene expression. (C) Model outlining the process of chondrogenesis and chondrocyte differentiation. Important markers at each stage of chondrocyte differentiation are listed below the stage at which the genes are expressed. Superscripts indicate the level of gene expression. Ref.: Zuscik et al. 2008. Regulation of chondrogenesis and chondrocyte differentiation by stress. J Clin Invest. 2008;118(2):429-438. doi:10.1172/JCI34174 http://www.jci.org/articles/view/34174 |
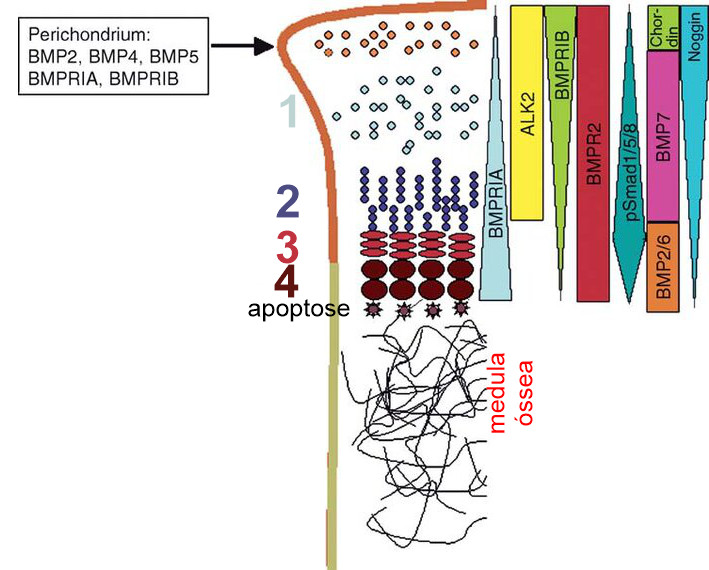 | Expressão de ligandos da família BMP e dos seus recetores na placa epifisária. Os números representam as camadas de diferenciação da linhagem condrocítica: 1 – zona de reserva ("resting" – stem cells); 2 – zona colunar (condroblastos, transit-amplifying); 3 – zona pré-hipertrófica (condrócitos); 4 – (condrócitos). A figura mostra também o pericôndro como produtor de vários destes ligandos e recetores. Chordin e Noggin são inibidores da sinalização BMP. doi: 10.1016/S0070-2153(06)76001-X. |
